
On December 15, Rethinking Schools editor Jesse Hagopian spoke with Kelly Lytle Hernández, Ahilan Arulanantham, and Mariah Tso, co-creators of the website Mapping Deportations.
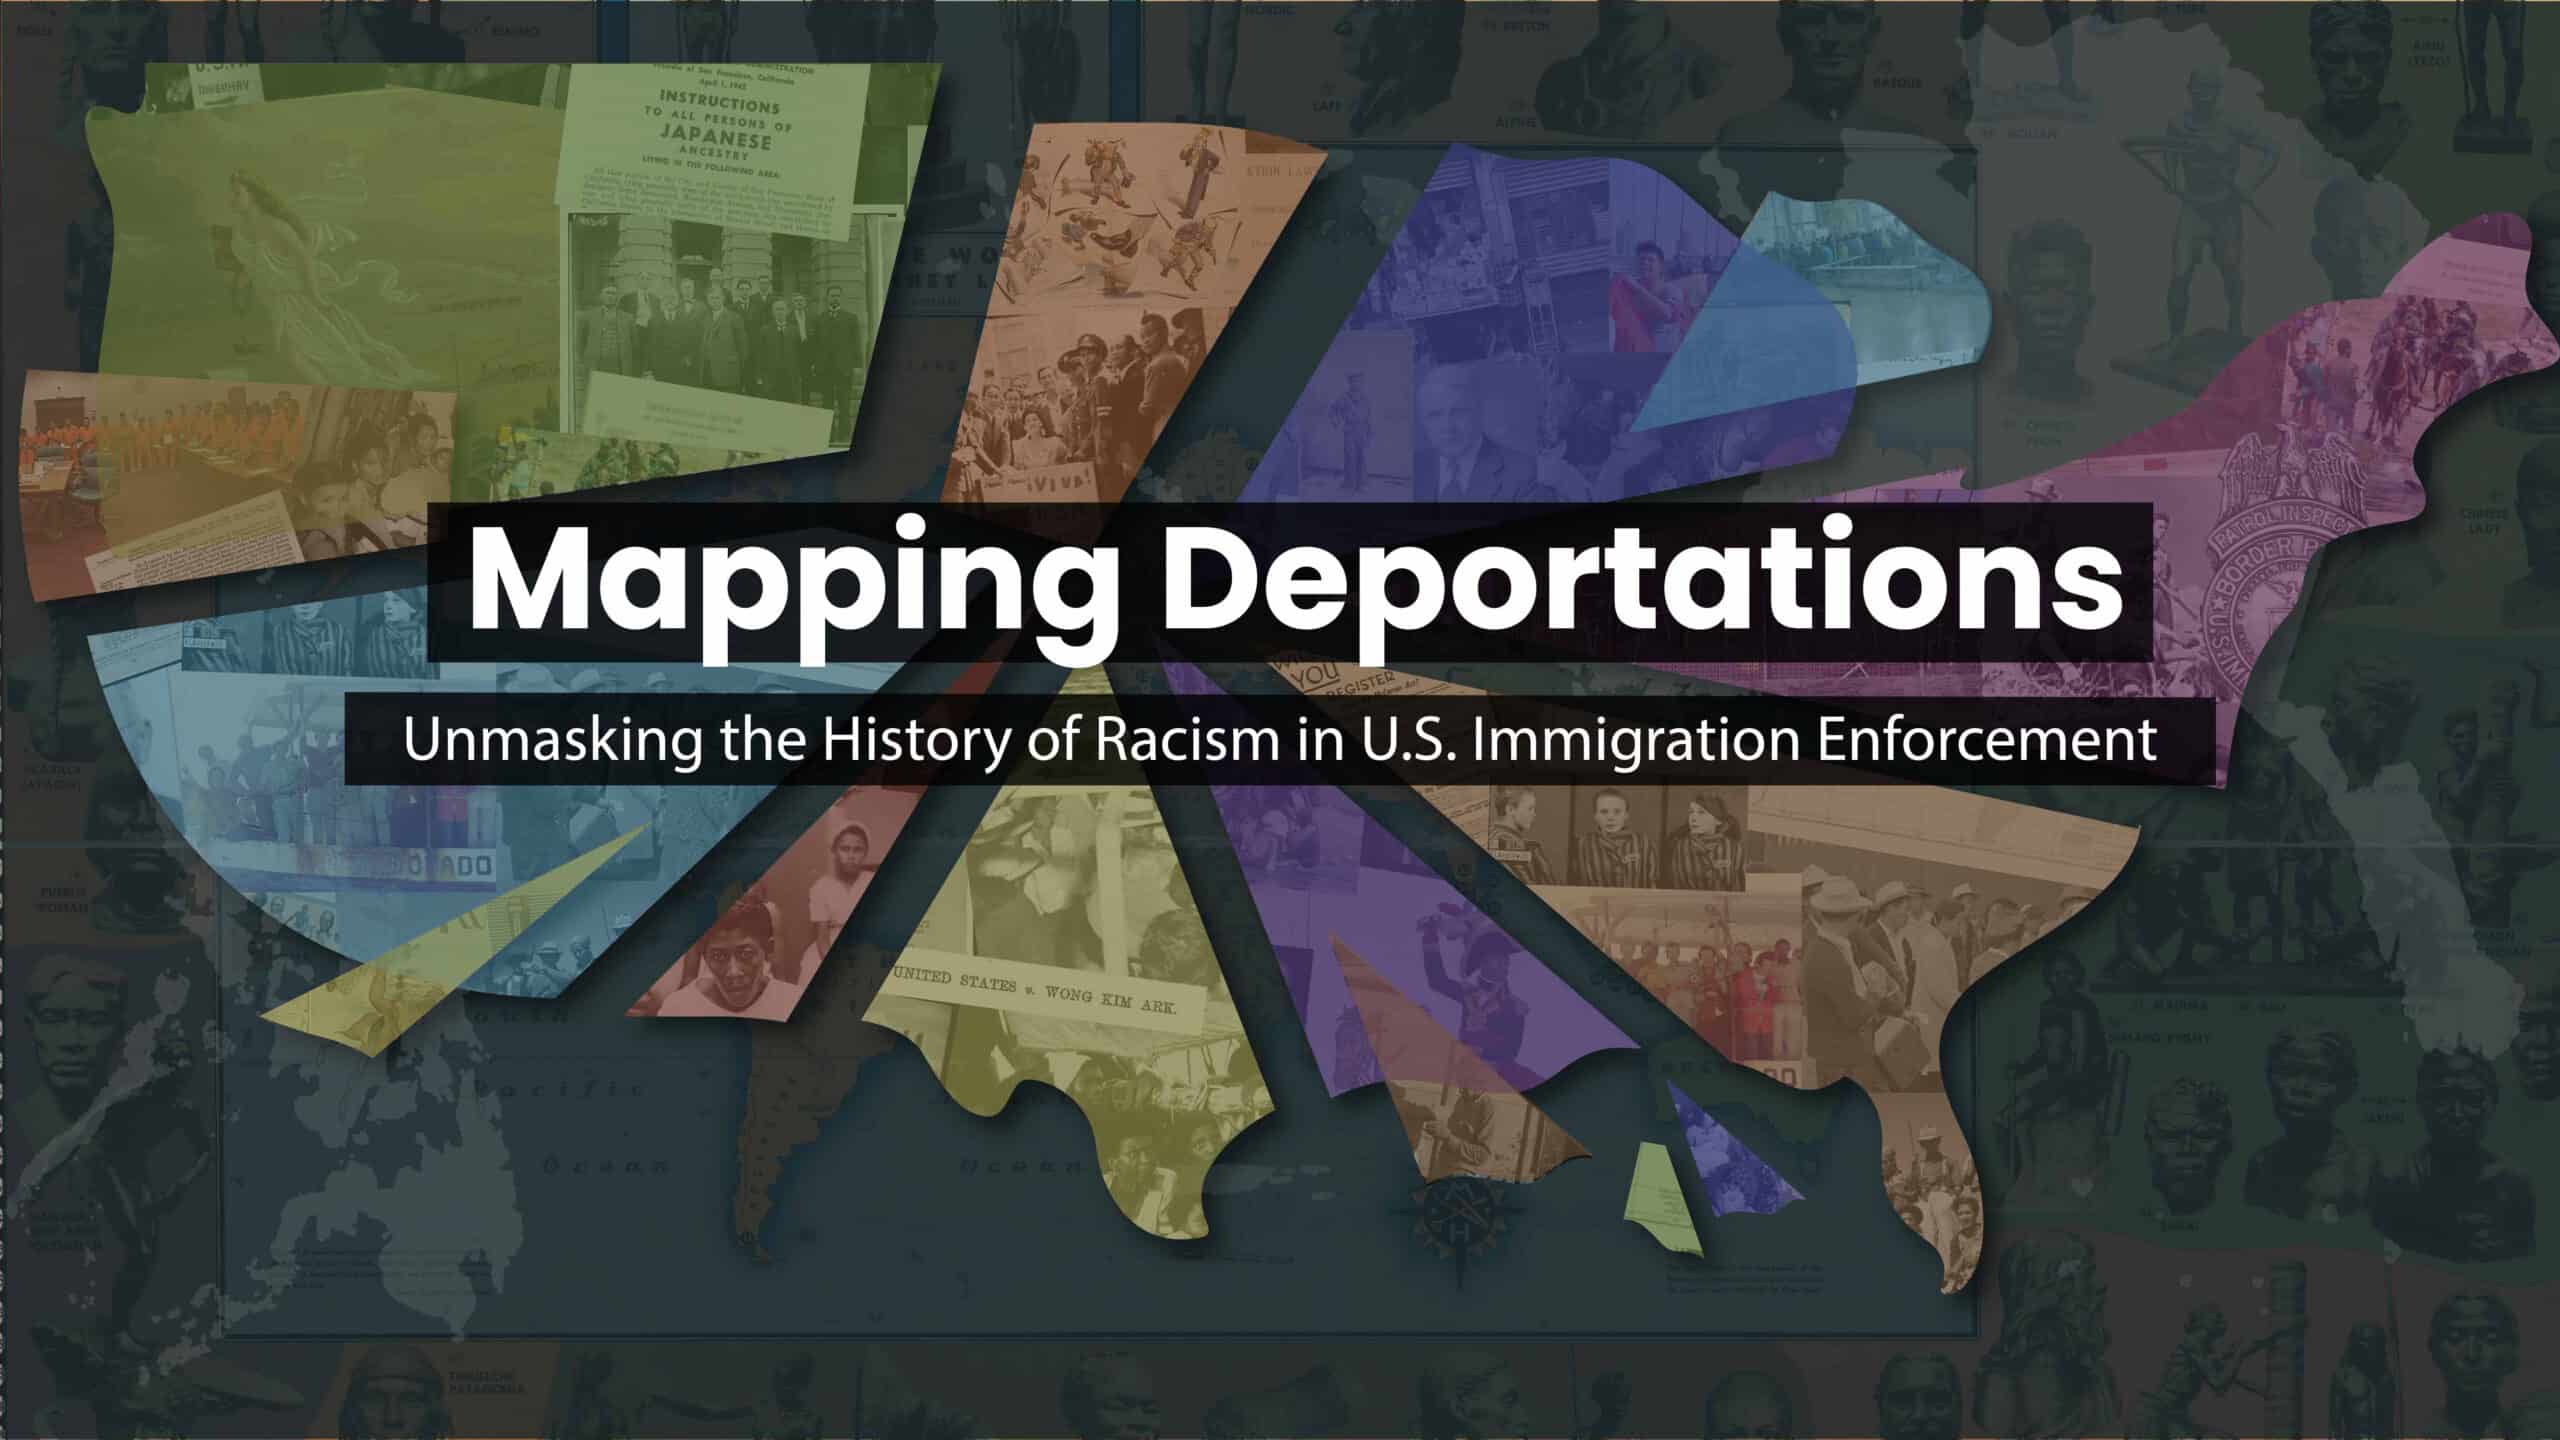
Mapping Deportations is a classroom-friendly digital resource that invites visitors to see the history of U.S. immigration enforcement not as a series of disconnected events, but as a pattern.
For more than two centuries, U.S. immigration enforcement has favored Europeans and their descendants while targeting migrants of color for exclusion, removal, and punishment. Mapping Deportations offers data visualizations and a timeline to delve into the details of deportation, including how the history of anti-immigrant legislation and racism are intertwined.
During the session, participants brainstormed approaches to incorporating the website into their lessons on U.S. history, ethnic studies, math, geography, and more subjects. Once attendees and others have had a chance to try out these ideas and more that they develop, we will share them.
Mapping Deportations is a collaboration between the Center for Immigration Law and Policy (CILP) at the UCLA School of Law and Million Dollar Hoods.
Event Recording
Transcript
Click below for the full transcript with resources mentioned in the discussion.
Transcript
Jesse Hagopian (he/him): On behalf of the Zinn Education Project, we want to welcome everyone to our people’s history class on Mapping Deportations. My name is Jesse Hagopian, I’m a campaign director with the Zinn Education Project and an editor for Rethinking Schools. Thank you for joining us to imagine concrete ways we might teach using Mapping Deportations. This is a classroom-friendly, unique website that uses maps and data and other information to unmask the past and the present of structural racism in the United States’ immigration regime.
The creators of the website, which tracks every deportation order by the federal government since 1895, will discuss how this new website provides a historical context for the current moment. So, I would like to welcome our panelists now. We have Ahilan Arulanantham, faculty co-director at the Center for Immigration Law and Policy at UCLA School of Law. We are also joined by Kelly Lytle Hernández, the Thomas E. Lifka Endowed Chair in History at UCLA, and by Mariah Tso, rebel cartographer and GIS Specialist for the Ralph J. Bunch Center for African American Studies, and the Million Dollar Hoods Project. Welcome to all of you. Thank you so much for coming and lending your expertise and this incredible website to our community.
Kelly Lytle Hernández: Thank you so much for having us. I will start us off. I want to first say thank you to the team at the Zinn Education Project. I reached out to them a couple weeks ago and asked if we could do this, that this is precisely the community that we want to be in conversation with in terms of sharing out this history and telling these stories and empowering our students with facts and with history. So, I’m going to talk really briefly about the origins of this project, then hand it off to my two colleagues to provide some brief introductory remarks as well. Then we’re going to circle back and go deeper into this website and walk through it with you all.
I’ll start by saying that this project, Mapping Deportations, came out of a conversation Mariah Tso and I had at least five years ago, if not more. At that time, I was giving a set of lectures about what I call the three forced migrations that made America, which is Native removal, the Transatlantic Slave Trade, and there was another forced migration we really hadn’t had a map of before, which was deportation. When I was teaching with my students, I had a map of the Transatlantic Slave Trade in two minutes that I could share. When I was teaching about forced removal, I had Claudio Saunt’s amazing visualization, Invasion of America, which was about Native removal across the 19th century. But no one had ever mapped deportation from the country, and so I had an idea about: What if we could do this? What if we could map every deportation that the federal government has ever conducted? I was chatting with Mariah in the hallway, her eyes lit up, and she said, “I’m all over it. I can build that map.” So I’m going to hand it to Mariah to talk really briefly about the techniques that she’s brought into building this featured map in particular. I don’t know if you want to share that now or later, but I’ll hand it to you, Mariah.
Mariah Tso: Yeah, I can talk a little bit more about the map itself, and I’ll let it play here in the background as I do that. As you go to our website, the first thing you’ll see is this missing map that Kelly and I had talked about in the hallway about five or six years ago. It’s a map that starts with a question about who it is that gets deported, [and] what’s the pattern.
In the past 127 years, there’s been over 8 million deportation orders, which is a number we know is increasing every day. And the pattern is that over 96 percent of those deportation orders have been issued to people from predominantly non-white countries, which is a number that’s far too high to be random. And it’s not. Those are a result of specific policies laced into racism. If you look at the quotes from lawmakers and policymakers over the years, that reveals even more. So the question we ask is: What work do deportations do? What is it that deportation is defending? And over the past 127 years, who is it that gets deported?
The map starts in 1895, because that’s the earliest year that we have deportation orders by country or region. Each dot represents deportation orders — the larger the dot, the higher the number of deportation orders. The technicality is we use the term deportation order, because the data refers to events rather than specific people. In the corner there, you’ll notice this racing bar chart that shows more detail. Overall, it’s grouped into nine geographic regions, and that’s because looking at data over the course of 127 years, there’s a lot of variability in how it’s collected, [and] the different categories federal authorities use. So the bar chart shows more specificity.
For instance, early on, it’s collected by what’s grouped as race or peoples, and then after that, it’s generally by country of nationality. And the data sets are coming from publicly available data, from annual reports issued by federal immigration authorities, whether that’s the Commissioners General of Immigration from 1895, or today being the Department of Homeland Security. So, it’s a map that I recommend you view more than once. You can speed it up, you can slow it down, rewind, hit pause. And as you view the map, you might have a lot of questions, so I recommend you write them down. What is it that you notice? What surprises you? And that’s where the rest of the website comes in. As you view this map and have questions about different patterns, what other information is needed to contextualize and explain the patterns? And so, I’ll leave it at that and pass it back to Ahilam.
Ahilan Arulanantham: Thanks, Mariah. My background actually is primarily as a civil rights attorney. I worked at the ACLU for almost twenty years before joining UCLA in the law faculty here in 2021. When I came, shortly after that, I learned about what Kelly and Mariah were doing, and it struck me as really important, and also intersecting in an important way with the project that we were undertaking here at the Center for Immigration Law and Policy. Because we were involved in litigation at that time against the Biden administration, and struggling both to get accountability for the racist immigration policies that had arisen during the first Trump administration, but also even to challenge what were ongoing policies that, in our view, reflected the race discrimination of the immigration laws going back a long, long way that were operating during the Biden administration — like the differential treatment of Ukrainians on the one hand, and people from Afghanistan and from Central America on the other, just for example.
So, we had the idea of working together to add to the maps — which I think are the heart of the website and the most amazing kind of visual aspect of it — a set of summaries that were historical summaries of the changes in immigration law and policy that happened over a set of time periods. Those are on the map and on the website. And then also timelines with more specific events, which obviously can’t uncover every significant event in the history of immigration law. But we tried to put in a number of them that helped to explain the data that Mariah had shown through these visualizations.
So the website, [and] I’ll get to this more in the next round, but we have a number of entries on the website that explain important historical changes in immigration law and policy in the past, then, in certain crucial spots, try and connect them to what’s happening today. And this is the last thing I’ll say on this round. I still do a lot of litigation. I teach and litigate here at UCLA, and we try really hard to make the argument that in federal court, immigration policies are unconstitutional because they’re grounded in racism. And you hear it in the newspaper. We started this website before the second Trump administration, to be clear. We’ve been working on this thing for several years. We started it during the Biden administration. And it’s so obvious, it’s staring you in the face, how this racism is operating; and yet it’s very, very difficult to win the argument that a policy is unlawful because it’s motivated by racism in court. To us, that’s a product of the fact that the education system has not succeeded in creating the transformation that we need, because we haven’t been taught immigration law the way that we should have. I certainly wasn’t taught it in the way that I should have, in a way that pasted it in the context of its white supremacist origins. So that’s kind of the broader purpose that we had behind the website, as well. And with that, I’ll pass it back to Kelly.
Hernández: Excellent. Folks, we are now going to head into the website, and Mariah’s going to share while I talk a little bit about the history. Once Mariah had created this beta version of the map that you all just saw, that she just walked us through, it became really clear that we needed to provide a lot more information so that people could make sense of the trends that they were seeing in that map. So we spent quite a bit of time developing a timeline so that people could understand why certain changes or why certain communities were being targeted over time.
What I want to do right now is walk us through that timeline really briefly. It’s five separate eras over the course of the whole of U.S. history. The first era you see featured here is 1790 to 1876. We begin that era in 1790, because that’s the year of the first Naturalization Act, which limited naturalization to free white persons. One of the things that we do that’s a little bit different in this era, that you may or may not have come across, is we have a focus on both Native removal and enslavement as being the foundation of the creation of the United States as a white settler republic.
Then we talk about the origins of efforts to control free migration in that settler republic, and that really begins with efforts to limit free Black mobility. In particular, as soon as the Haitian Revolution began in 1791, states across the country began to pass laws limiting free Black entrance into their states. In 1803, as the Haitian Revolution’s about to come to its conclusion — creating the first free Black republic on Earth, [and] the Second Republic in the Americas — Congress doubled down on these state-level immigration bans that target free Black migrants by passing this country’s very first immigration ban. The Immigration Act of 1803 prohibits entry to all free Black persons into any state where they’re banned from entering. That’s Congress’s first immigration ban.
What Mariah’s showing you here now is the map of migration control prior to the Civil War. Every area that has a black slash is a state or a territory that passed at least one anti-Black migration ban prior to the Civil War. The base map here is Indigenous territories, that as the United States grows across time, it’s doing so by laying claim to, invading, and occupying Indigenous territories. We’re abrading together the story of occupation and exclusion. So that’s era one.
We’ll move to era two now. In this era, let me make sure I stay talking about the creation of a whites-only immigration system. It documents how the federal government took control of the immigration system in the 1870s. And with that authority, which I can talk about in detail, but the federal government’s authority of aviation control is something called plenary power, that the federal government has absolute and exclusive authority over immigration matters when it comes to exclusion and deportation. What that absolute authority means is that the rules of the Constitution don’t apply to immigration control, especially here in the late 19th century. What we do is we talk about in this time period how the federal government takes this plenary power between the course of the 1870s and the 1920s, and stitches together a whites-only immigration system that effectively bans almost all Asian immigration, [and] makes it incredibly difficult for Black migrants to enter the United States, criminalizing most Mexicans for entering the country, and does all of this while also creating mechanisms for Canadian and European undocumented immigrants to legalize their status. All that together is what we describe as the whites-only immigration system.
I also just want to take a moment here to be really clear about this concept of the whites-only immigration system. It’s not a system that keeps all non-white immigrants out of the country all the time. That’s not how Jim Crow operated. It is a system that reserves front door entry for European immigrants and their settler descendants around the world, but then keeps side doors and back gates open for non-white migrants to enter, either criminalized or temporary, but to come in and do the labor of the country. So that second area is about the whites on the immigration system.
The third era that we have here is what we call Consolidate and Carry Forward. Between 1930 and 1954, we document how, amid the Cold War and the Civil Rights Movement, Congress amended the nation’s admissions rules while always actually strengthening and tightening the screws on this whites-only immigration system. For example, in 1952, Congress stopped categorically barring Asian immigration to the United States, but also imposed a new numerical cap on the number of Asian immigrants allowed to enter the country every year. That’s the Asia-Pacific Triangle. Meanwhile, during this time period, the U.S. Border Patrol unleashed what was, until recently, the largest deportation campaign in U.S. history, and that campaign targeted Mexican nationals. They did all this while legislators at the helm of the immigration system were talking about maintaining the racial complexion of the population.
And then our fourth era, Amend and Enforce, details how, although it is often assumed that the 1965 Immigration Act purged racism from the U.S. immigration system, in fact, the whites-only immigration regime endured in many, many ways. As you’ll see in our timeline, we detail how the 1965 Act abolished racism in the visa allocation system, but did not banish racism from the visa eligibility system. Since 1965, presidents have used executive orders and proclamations numerous times to limit visa eligibility by national origins and/or race in implicit [and] explicit ways. We also talk about how during this era, in 1975, the Supreme Court issued a ruling called Brignoni-Ponce, which sanctioned the use of race, namely Mexican appearance in immigration law enforcement operations. The punchline here is really that although we think racism was purged from the immigration system in 1965, we’re documenting and laying out how racism retained or remained a part of the system after the Civil Rights Movement.
Then finally, era five. We talk about how, since 1991, the federal government has built the largest immigrant detention and deportation system in the world, conducting more than seven million deportations, issuing more than 25 million voluntary departure orders during this period. A lot of this links together immigration control and the criminal legal system, making mass deportation really a component of the much larger criminal legal system, or of mass incarceration. These agreements, as many people probably know, operate really as force multipliers, allowing federal immigration law enforcement to tap into the larger criminal legal system, and ramping up deportations at the same time that they’re exacerbating the racial disparities of deportation. So, the racial disparities in deportation actually grow deeper during this time period.
In sum, our historical timeline tracks how, amid the explosion of Native nations, U.S. authorities targeted Black migrants for exclusion, punishment, and removal. By the 1920s, they had crafted a whites-only immigration system that, to date, has been amended but never abolished. The timeline documents how, since 1965, even after the Civil Rights Movement, racism remains a primary factor in immigration law, policy, and enforcement. So that’s a quick introduction to the historical overview that we provide in the timeline. I’ll hand it back to my colleague Mariah to talk a little bit more about some of the visualizations she’s created.
Tso: As mentioned, there’s quite a bit of context that’s needed to understand all of these complex mechanisms and histories that are interconnected. One of the things you see is that regardless of which way you look at it, the patterns are pretty persistent. One of those things is you can look at our main feature visualizations that are on our timelines. You can do a detailed breakdown of deportations by year. Almost all of the charts are interactive in some way. So you can click on these and choose particular years. If you’re curious about different patterns throughout history, you can dive into the details. This is featuring all of the different ways migrants have been expelled, deportations just being one mechanism. And you can, again, interact and look at patterns across different time periods.
There’s the whites-only immigration regime map, which I like to think of as a kind of data power analysis. Something I talk about in my work is intersections with critical data, which means that the numbers don’t speak for themselves, so what other context do you need to understand those things? Other visualizations, again, include a deeper dive into different mechanisms. This one looks specifically at Black migration, and how, for a number of years, migration was negative post-1924. Hidden data is an estimation of how many deportation orders might be toward people who are Indigenous, and speaking into who gets erased in broad regional and national categorizations. So this is something that’s undoubtedly an underestimate, but it’s trying to poke holes into the assumptions that we make about the way that people are categorized in these systems, and what that erases.
Here’s one that looks at the parallel rise between mass incarceration and mass deportation. In other words, it’s a huge bank of all the quotes that we’ve referenced throughout the website and more. This is something that we’re also working on, updating with the present moment. This one is an updated map of the first one that contrasts then and now, showing how a lot of the rhetoric is continued in the present day. Then this one’s a blank map to be used for what are some patterns that are missing, or some other things that you can add to the story using other things in the website. And then the very last one is a future reimagining of our feature map that plays the map in reverse. So it’s a way to break the pattern that you see on the website. That’s a quick overview of all of the additional visualizations. So I’ll pass it over to Ahilan.
Arulanantham: In the interest of time, because I know we want to spend some time talking through potential ideas for curriculum, I think I might just quickly summarize what I was going to show, and you all can spend some time on the website finding it. I was really just going to make the point that the website and the timeline entries do have a lot of material that helps to connect to the present day, which I’m sure is going to be relevant to the teaching. And just seeing these comments, I can tell it’s very live for many of you. If you look for those buttons that say fast forward to now, there’s a bunch of these little buttons in there, and that’s something where there’s some historical material that’s being connected to something to the present day.
The Operation Wetback entry draws a connection and a description to the raids that are happening now, because that’s what the president said. He specifically said he wanted to recreate that. Or Kelly, when she was showing hers, referred to the case Brignoni-Ponce, which is about the use of race in immigration stops. That’s actually an issue that was just in the Supreme Court a couple months ago, and is still live and probably going back to the Supreme Court shortly. So we have those there, and that’s definitely something that can be used as a resource, if you hunt for those little boxes.
Then the other thing is, we have . . . because obviously, it’s not only a story of the oppression of immigrant communities, it’s also the stories of our communities resisting, our people fighting back in many ways and struggling to create justice. So we have a few, we want to do more of them, but we have maybe four or five of these already, what we call resistance stories — stories of people who resisted and advanced the cause for social justice for immigrants. And those are also embedded there.
I was going to show you one, there’s an interesting one from the 1950s about a Korean-origin labor organizer who grew up in LA named David Hughes, which you can find in the 1950s. But there’s a bunch of those scattered here and there throughout the website. So I think I’ll probably leave it at that, rather than . . . I mean, I could show you in detail how to navigate to them, but you can see that if you go to the timeline and go down. I think I’d rather do that so we can have time for these breakouts that you all wanted to do. Birthright Citizenship has a fast-forward to now button on it, too, for obvious reasons, unfortunately.
Hagopian: Alright, wonderful. What a powerful tool! And I think you already saw in the chat there’s a lot of love for how much work you all put into this incredible website. I think educators are already seeing how useful this is going to be. We are going to move to breakout groups in a little bit, but before we do that, I just wanted to pause and see if there were any initial questions that you all had for our panelists, before moving to the breakout groups and thinking about how you might use this website in your classroom [and] speaking with other educators about that. Did any questions come up that we should address? I see a hand here. Yes, Mireille?
Mireille E.: Hi! Hello! I’m just wondering how much is the data skewed by people who get deported multiple times? I mean, of course it’s still important to note even if a person gets deported multiple times, the trends, because how persistent are they?
Arulanantham: Yeah, that’s a great question. We were definitely careful to specify in the data that we’re talking about deportation orders and not unique individuals, because it is possible for people to have deportation orders issued against them more than once. Nonetheless, for a variety of reasons that we lay out on the website, I don’t think that if you controlled for that, you’d get anywhere near the massive disparity that we see. You can also see that in other ways, like the number of deportations to Caribbean nations is grossly disproportionate to the number of admissions relative to, say, Europe. And those are both situations where you don’t have overland deportation. But yes, it’s not 8 million people deported, it’s 8 million deportations. And that’s what the website’s measuring. There’s no way, unfortunately, that we’ve been able to find thus far to match up, to figure out, to track unique individuals.
Hernández: And let me just add that that’s most important when it comes to voluntary departures, which is this informal kind of deportation, that yes, some people might even be removed or departed two times a day, three times a week at certain periods of time. And for me, what’s really important to note about that is that it is absolutely true that there are repeat removals happening, as the overall number of removals go up. To me, what’s significant here is that we are spending so much money removing one person over and over and over during the course of the week. We’re also often using the increasing number of arrests or apprehensions as a logic and a rationale for sending more money into doing arrests and apprehensions, and when you’re just really rounding up the same person over and over and over again, as opposed to finding new ways to deal with this issue. So when you raise this question, it’s a great data question to talk about with your students.
Hagopian: Kelly, I just had one quick question for you before we move to breakouts. I just wanted you to underline what you said about when the first anti-immigration law was passed. When you first told me that, I hadn’t put that together before, and I think some of our teachers do teach about the Haitian Revolution, but maybe not its connection to U.S. policy.
Hernández: Sure. So, Congress’s very first immigration ban was the 1803 Immigration Act, which you can see in our timeline. The impulse behind the passage of that act was the Haitian Revolution. The fear in the United States, especially among enslavers, was that abolitionists, revolutionaries from the Caribbean, namely from Haiti, would get on ships and come to the United States and either actively incite the enslaved to revolt, or inspire the enslaved to revolt. So the very first immigration ban in the United States targets free Black migrants to keep out those abolitionists. I should also say that those codes, state by state, tended to say, If you are a free Black migrant, or in particular, a free Black sailor who comes to the United or comes to, say, South Carolina, if your ship docks here, while you are in South Carolina you will have to be held in jail, subject to mandatory detention. If your ship captain does not pay your various fees that go along with you being detained in South Carolina, or Texas, or Louisiana, or Georgia, or every southern state, you can be sold into slavery. That was the punishment for unlawful entry for free Black migrants, potentially to be sold into slavery. So, this is all happening amid the Haitian Revolution, and they try to shut that down. So I think about the origins of immigration control as not just being racist and anti-Black, but also being counter-revolutionary, and what the Haitian Revolution could have meant in terms of building freedom for all of us in that moment.
Hagopian: That’s such a powerful framework for understanding immigration in this country, and so much about our nation. So thank you for that.
Arulanantham: If we have one second, I just was going to say that the point that Kelly was just making now about how the origin of federal immigration law, deportation, goes back to the Haitian Revolution, even if that’s the only thing you took from this discussion, it would be so important. Because the way we were always taught immigration law was that federal deportations started in the Chinese Exclusion Era in the 1870s. While that’s important, a hugely important era and definition in a lot of ways, it really misses the connection to the points that Kelly was making, the anti-Blackness and counter-revolutionary aspects of immigration law. So, I hope that’s one thing among many that you can pick up from the website.
Hagopian: Yes, thanks for underscoring that again. Especially because we know that Haitians today are under attack, and again, their temporary protected status is being threatened, and they are in danger of mass deportation again. So we have to understand where it came from to understand what’s happening right now. And we know Ahilan is working hard on that case right now, so thank you for that.
[breakout rooms]
Hagopian: Alright, everybody. Looks like we are slowly coming back. I see that we have some good questions and shoutouts coming up in the chat, grateful for the resources that were created. I’m going to turn it back over to the panelists.
Hernández: Well, I’ll just jump in and say that one thing I heard across several groups I went to is that people really haven’t had much opportunity to learn about deportation. That there’s been more teaching about immigration. But the opportunity to learn about the tools and the history of forced removal have been more limited. So maybe if there are more questions out there, content-related questions or anything, maybe we could just do that. To make sure people get the most out of this.
Hagopian: Yeah, I would love to see more questions. I love this idea of bringing this tool to my next team meeting for all my curriculum designers to explore and make meaningful connections to their everyday design. New social studies development grounded in culturally responsive inquiry. New science development embedded in data science, new math and elaboration development. Connecting learning across content areas. Good idea. Also, making images from the site into puzzles for students, I love that idea. Welcoming student groups to explore and create their own lines of inquiry, to co-create the learning space for a deeper dive. And to implement student choice. So many creative ideas about how to use this site are coming out. I love it. There’s a question by Rose. Are there speakers who can come to classes? And then Tanya asked about virtual visits. So any ideas around that?
Hernández: We don’t have a speakers bureau as of yet, but that’s a great idea, and one that we should definitely think about. I also saw a question about racial capitalism and deportation. If the first immigration ban was created to protect the institution of slavery, that is the definition of the relationship between deportation and racial capitalism. But we try to flag those moments throughout. I mean, one of the things that we were always talking about when developing this website is that deportation isn’t always about keeping people out or removing them, but actually about subordinating those who are here by creating a system of fear. And that is racial capitalism at work. How do you create a caste group that is a caste group of laborers, and deportation becomes a part of that. Yeah, the back door I see you talking about. I don’t know if my colleagues want to add something there.
Arulanantham: No, I don’t know, Mariah, if you want to take this question. There’s two sources, the question on whether it means the person left in ICE data, it does, and in UAR data, it doesn’t, right?
Tso: What was the specific question about?
Arulanantham: Does the deportation order mean the person left, and the whole question of in absentia orders, and all that.
Tso: Oh, yes. So for some years, it is what’s reported as a confirmed movement, so that would be yes. There is some variability year to year, so that’s not always confirmed, but for a big chunk of the years, that’s true. And then yeah, we were not able to track by individual because that’s not explicitly tracked for a good portion of the time. Or they’re in completely different systems.
Hagopian: There’s another question that I think related to what Kelly already addressed here. How would a shift to anti-Blackness force us to ask different questions about the data, the experiences of migrants, and the global system of racial capitalism? Do you feel like you answered that, or is there anything you wanted to add?
Arulanantham: There’s a lot on the website that speaks to that question about the rise of visas. Kelly’s really the expert on this subject, but really the whole system of visas is probably created, at least in large, significant part, to essentially allow discrimination in the process of picking who comes here. You see a substantial drop in Black migration. Now we’re talking about free Black people, this is the 1920s, to the United States. Basically, right after the visa system is created.
There’s also a long history of discrimination in the humanitarian admissions program. I’m talking about Haiti a lot, obviously. Also, Indigenous people from Central America were treated differently from, for example, white Cubans, or in the modern day, Ukrainians. That history really is very much a history of anti-Blackness, anti-Blackness and indigeneity, like dark people, you know. So it’s really all over the website. I think part of what we’re trying to do, if we’re talking to immigration law scholars and people who study it in history at the graduate level, in law, it’s like trying to reframe that so that people see immigration law that way. I’m not an expert in high school or middle school curriculum, but I would think there’s probably ways to incorporate that message into curriculum at this level, too. But you all would know better than us how to do it.
Hagopian: No doubt. I see one more question I think we have time for. How do you handle possible triggers in the classroom discussions? How do you have a safe discussion? We know that students are being kidnapped by ICE, and some of these conversations strike really close to home. I don’t know if you all have any ideas for that.
Hernández: I don’t. I mean, you all are experts in working with the K–12 student population. I will say in working with the university students, my experience is that knowledge is power, in the sense that students often feel confused and overwhelmed by what’s happening to them, communities, and their families, and there’s something to be said about being able to identify the boogeyman, to be able to identify the monster that’s knocking at the door. And this history helps them do that. It doesn’t make them go away. It is a very hard set of conversations to have. The history, I think, that we’re trying to lay out here also helps them to build solidarities. We’re chronicling across communities, across time, how so many of us have been impacted by this regime, and so when we look out across the schoolyard, when we look out across the classroom, when we understand the stories, the crises that brought us all here together today, there might be new ways in which we can build solidarities and power in those communities as well. One thing that Mariah has often taught me is that there’s more than one kind of power, and the power of violence is one, but the power of community and the power of love, the power of being in relationship, will always overcome the violence. And that is on this website as well.
Hagopian: I love that.
Arulanantham: For me, I would say there was one person in my breakout room who I think was an elementary school teacher who was talking about how their classmate is being deported, so I think shoving it under the rug is not it. Obviously, you’ve got to take it to different people at different levels. We have undocumented students. I have undocumented law students who were terrified when the raids started in Los Angeles, and they’re coming, they’re working with us every day. There’s no right answer, but ignoring it is not the right answer. So you’ve got to put it there and find some way of engaging with it, you know?
Hagopian: Yeah, thank you for that approach. I would just add that I think when we couple this important discussion also with the incredible contributions that immigrants have made to our society and our culture throughout history, we are also empowering them and creating a safe space where we’re showing how much we value them, and not only talking about their oppression. I think that helps to build safer conversations in this really difficult time.
But we have to wrap up, so I want to say thank you from the bottom of my heart for all this work, and for presenting it to our community. Thanks to everybody for your commitment to learning and teaching a people’s history, and to our breakout group facilitators for helping us make this session possible.
While this transcript was edited, there may be minor errors or typos — if you notice something you believe to be incorrect, please contact us at [email protected].
Resources
Here are many of the lessons, books, and other resources recommended by the presenters and participants:
Lessons and Curriculum
|
|
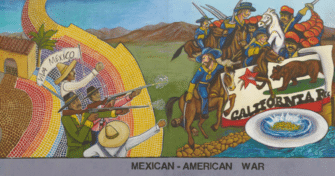
Deportations on Trial: Mexican Americans During the Great Depression by Ursula Wolfe-Rocca From the New Deal to the Green New Deal: Stories of Crisis and Possibility by Suzanna Kassouf, Matt Reed, Tim Swinehart, Ursula Wolfe-Rocca, and Bill Bigelow U.S. Mexico War: “We Take Nothing by Conquest, Thank God” by Bill Bigelow, with a student reading by Howard Zinn The Line Between Us: Teaching About the Border and Mexican Immigration by Bill Bigelow (teaching guide) |

Books
  |
Bad Mexicans: Race, Empire, and Revolution in the Borderlands by Kelly Lytle Hernández (W. W. Norton & Company) Migra!: A History of the U.S. Border Patrol by Kelly Lytle Hernández (University of California Press) Still Dreaming / Seguimos soñando by Claudia Guadalupe Martínez, illustrated by Magdalena Mora, and translated by Luis Humberto Crosthwaite (Children’s Book Press, CA) Return to Sender by Julia Alvarez (Yearling) Harvest of Empire: A History of Latinos in America by Juan Gonzalez (Penguin Group) Find more book recommendations for teaching about immigration and deportations at Social Justice Books. |
Additional Resources
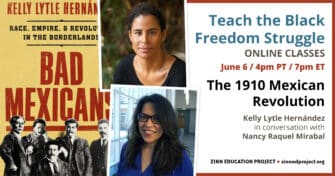 |
Kelly Lytle Hernández on the 1910 Mexican Revolution (Teach the Black Freedom Struggle series) Downplaying Deportations: How Textbooks Hide the Mass Expulsion of Mexican Americans During the Great Depression by Ursula Wolfe-Rocca (If We Knew Our History series) |
Video
This Day In History
The dates below come from our This Day in People’s History collection, which contains hundreds of entries all searchable by date, state, theme, and keywords.
|
|
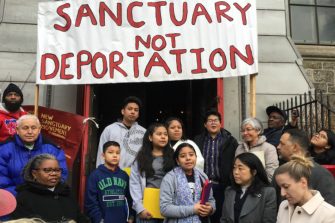
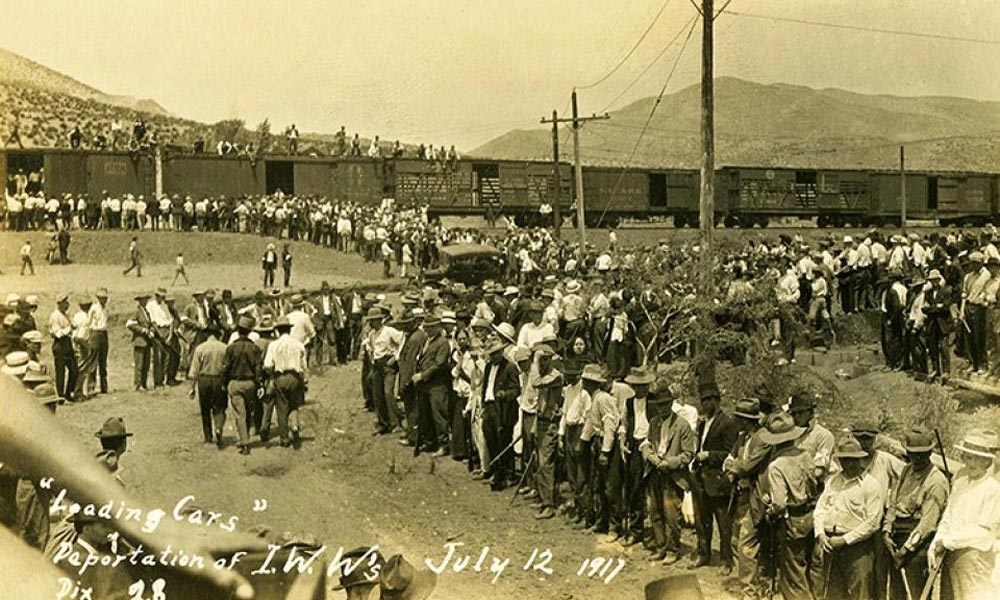
July 6, 1798: Alien Enemies Act Signed Into Law Feb. 28, 1803: First Anti-Immigration Law Targets Black People Jan. 1, 1804: Haitian Independence Sept. 14, 1911: El Primer Congreso Mexicanista Convenes in Laredo May 23, 1914: Indian Migrants on the Komagata Maru Denied Entry Into Canada Jan. 28, 1917: The Bath Riots July 12, 1917: The Bisbee Deportation Jan. 28, 1918: Porvenir Massacre May 16, 1918: The Sedition Act of 1918 Enacted Nov. 28, 1919: Jane Addams and Palmer Raids Jan. 5, 1931: Lemon Grove Incident Feb. 26, 1931: La Placita Raid Jan. 31, 1938: Emma Tenayuca Leads Pecan Shellers Strike Jan. 28, 1948: Plane Wreck at Los Gatos March 24, 1982: The Sanctuary Movement Starts in Arizona April 10, 2006: Immigrants’ Rights Protests Peak June 28, 2018: End the Contract with ICE Campaign Begins in Grand Rapids |


Participant Reflections
Here are more comments that participants shared in their end-of-session evaluation:
What was the most important thing (story, idea) you learned today?
How do I pick just one? This website is a gold mine. The timeline, the different maps and data. I can use so much from this to create lesson plans! Plus, there is just so much I didn’t know about Haitan deportations that I am really glad to get a glimpse of.
The role of Haiti in forming the first U.S. immigration law — I had no idea!
Meeting — no matter how briefly — other educators and researchers who are analyzing and trying to teach these interlinked issues is the best part. There wasn’t any information shared in this session that was irrelevant, which is not something you can say about every gathering of educators, but it seemed to be full of people with ideas who are thinking through what to do and how to do it the most effectively. Let’s have more!
I need to be more informed. Resources like Mapping Deportations are crucial for representing my students and our shared world more accurately.
Making sure that there is empathy in the discussion of this topic as students might be personally impacted by deportation stories.
That we really should be framing immigration control as rooted in counterrevolution regarding Haiti and the preservation of the institution of slavery.
The most powerful idea was framing U.S. immigration enforcement as a “race making” institution that has consistently produced racialized outcomes since the nation’s founding. This provides the structural thesis I need to move beyond analyzing isolated policies and instead analyze deportation as a continuous system of social control and population management.
This Mapping Deportations website offers rich facts and multiple lines of inquiry around U.S. deportation patterns and its direct connection to anti-Blackness, the Haitian Revolution, and what the revolution meant to racial capitalism. It meant that racialized labor could, in fact, refuse access to their labor and the capital it produced for the elite, planter class. That connection between the need for the U.S. to control nonwhite immigration while simultaneously permitting some through the back/side door is deliberate and helps understand the color of capitalism, whereby nonwhites are disproportionately exploited as surplus labor which is paired with the land/resources of these predominantly nonwhite groups/nations.
What will you do with what you learned?
I have already shared the Mapping Deportations website with multiple teachers, and I am excited to dig into all of the resources.
I will share this information with other teachers in my school. We can use department and course team time to develop a plan to use this amazing resource in our classes.
Students deserve to know how history is impacting them, and it can help them connect how these deportations happened around different events in history. History isn’t isolated. It’s all interconnected, and this can help me show that to them.
Mapping Deportations will provide several ways for my students to access information in a new way outside of reading documents. Putting visuals to the numbers will make it more engaging. I teach U.S. history from a current events perspective. What are the events that have led us to the events of today? This website will enable students to find the links between past immigration/deportation policies and what is going on today.
As a teacher educator, I will be sharing this incredible site with all of the teachers I am in contact with.
I’m bringing this tool to my next team meeting for all my curriculum designers to explore and make meaningful connections to their everyday design — new social studies development grounded in culturally responsive inquiry arc, new science development embedding in data science, new math and elaboration development connecting learning across content areas, etc.
How was the format for the class?
Everything worked great!
The format was great! I thought it was so great to have a high school student in my group.
The format was great and the demonstration was great. I’m looking forward to watching the recording and reading the follow up notes.
I thought it was perfect. I liked the format of the presenters coming in with a speech and talking points prepared, rather than interview-style. There was so much information packed into the intro. Also, I liked the time for participant questions at the end. Like most Zinn Education Project events, it felt very focused on info and not filled with fluff, which I always appreciate.
The entire presentation was wonderful. My group’s conversation was so rich, and all were excited to dig into this website with their students.
Presenters
Kelly Lytle Hernández holds the Thomas E. Lifka Endowed Chair in History and directs the Ralph J. Bunche Center for African American Studies at UCLA. A 2019 MacArthur fellow, she is the author of Bad Mexicans: Race, Empire, and Revolution in the Borderlands, Migra!: A History of the U.S. Border Patrol and City of Inmates: Conquest, Rebellion, and the Rise of Human Caging in Los Angeles.
Ahilan T. Arulanantham is Professor from Practice and Co-Director of the Center for Immigration Law and Policy (CILP) at the UCLA School of Law. Ahilan teaches in the law school and also maintains an active litigation practice. He has successfully litigated a number of cases involving immigrants’ rights, including Franco-Gonzalez v. Holder, the first case to establish a federal right to appointed counsel for any group of immigrants; Jennings v. Rodriguez, which secured the due process rights of immigrants jailed for years while litigating their deportation cases; and, most recently, Ramos v. Nielsen, a challenge to the Trump Administration’s plan to end the TPS program for immigrants who have lived here lawfully for decades. Ahilan has argued three times before the United States Supreme Court, most recently in the fall of 2021 on behalf of Americans of the Muslim faith who were targeted by the federal government for surveillance because of their religion, in FBI v. Fazaga. He has also testified before the United States Congress on three occasions, and served as a Lecturer at the University of Chicago Law School and at the University of Irvine School of Law, where he taught on Preventive Detention.
Mariah Tso is a GIS Specialist for the Ralph J. Bunche Center and the Million Dollar Hoods Project. Mariah received her master’s degree in geographic information systems from the University of Redlands and her bachelor’s in environment, economics, and politics from Scripps College. Her research interests include critical cartography, indigenous methodologies, and interdisciplinary storytelling.
Jesse Hagopian is an editor for Rethinking Schools, co-editor of Teaching for Black Lives, editor of More Than a Score: The New Uprising Against High-Stakes Testing, author of Teach Truth: The Struggle for Antiracist Education, and the Teaching for Black Lives campaign director for the Zinn Education Project. He previously taught Ethnic Studies and was the co-adviser to the Black Student Union at Garfield High School in Seattle.


Twitter
Google plus
LinkedIn